 Guides
 Integrating with Apache JMeter
Apache JMeter is a popular tool for load and functional testing and for measuring performance. In this article, we will give you hands-on examples of how to integrate your JMeter tests to Meliora Testlab.
-
Apache JMeter in brief
Apache JMeter is a tool for which you can design load testing and functional testing scripts. Originally, JMeter was designed for testing web applications but has since expanded to be used for different kinds of load and functional testing. The scripts can be executed to collect performance statistics and testing results.
JMeter offers a desktop application for which the scripts can be designed and run with. JMeter can also be used from different kinds of build environments (such as Maven, Gradle, Ant, …) from which running the tests can be automated. JMeter’s web site has a good set of documentation on how it should be used.
Typical usage scenario for JMeter
A common scenario for using JMeter is some kind of load testing or smoke testing setup where JMeter is scripted to make a load of HTTP requests to a web application. Response times, request durations and possible errors are logged and analyzed later on for defects. Interpreting performance reports and analyzing metrics is usually done by people as automatically determining if some metric should be considered as a failure is often hard.
Keep in mind, that JMeter can be used against various kinds of backends other than HTTP servers, but we won’t get into that in this article.
-
Automating load testing with assertions
The difficulty in automating load testing scenarios comes from the fact that performance metrics are often ambiguous. For automation, each test run by JMeter must produce a distinct result indicating if the test passes or not. The JMeter script can be added with assertions to tackle this problem.
Assertions are basically the criteria which are set to decide if the sample recorded by JMeter indicates a failure or not. For example, an assertion might be set up to check that a request to your web application is executed under some specified duration (i.e. your application is “fast enough”). Or, another assertion might check that the response code from your application is always correct (for example, 200 OK). JMeter supports a number of different kinds of assertions for you to design your script with.
When your load testing script is set up with proper assertions the script suits well for automation as it can be run automatically, periodically or in any way you prefer to produce passing and failing test results which can be pushed to your test management tool for analysis. On how to use assertions in JMeter there is a good set of documentation available online.
-
Integration to Meliora Testlab
Meliora Testlab has a Jenkins CI plugin which enables you to push test results and open up issues according to the test results of your automated tests. When JMeter scripted tests are run in a Jenkins job, you can push the results of your load testing criteria to your Testlab project!
The technical scenario of this is illustrated in the picture below.
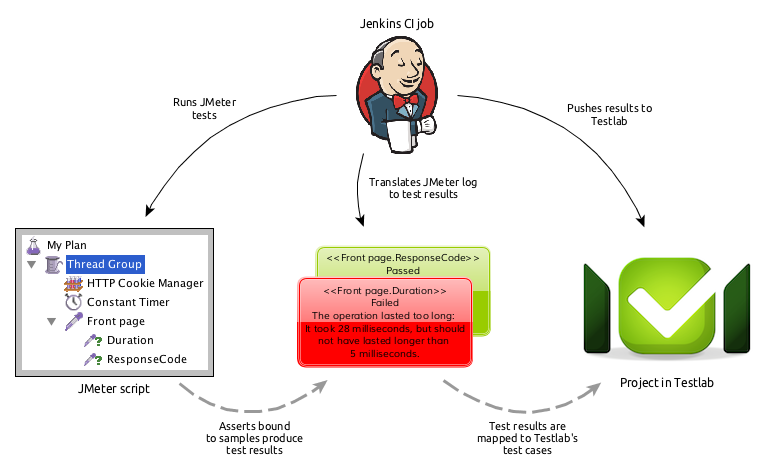
You need your JMeter script (plan). This is designed with the JMeter tool and should include the needed assertions (in the picture: Duration and ResponseCode) to determine if the tests should pass or not. A Jenkins job should be set up to run your tests, translate the JMeter produced log file to xUnit compatible testing results which are then pushed to your Testlab project as test case results. Each JMeter test (in this case Front page.Duration and Front page.ResponseCode) is mapped to a test case in your Testlab project which get results posted for when the Jenkins job is executed.
-
Example setup
In this chapter, we give you a hands-on example on how to setup a Jenkins job to push testing results to your Testlab project. To make things easy, download the testlab_jmeter_example.zip file which includes all the files and assets mentioned below.
Creating a build
You need some kind of build (Maven, Gradle, Ant, …) to execute your JMeter tests with. In this example, we are going to use Gradle as it offers an easy to use JMeter plugin for running the tests. For running the JMeter scripts there are tons of options but using a build plugin is often the easiest way.
1. Download and install Gradle if needed
Go to www.gradle.org and download the latest Gradle binary. Install it as instructed to your system path so that you can run gradle commands.
2. Create build.gradle file
apply plugin: 'java'
apply plugin: 'idea'
apply plugin: 'jmeter'

buildscript {
    repositories {
        mavenCentral()
    }
    dependencies {
        classpath "com.github.kulya:jmeter-gradle-plugin:1.3.1-2.6"
    }
}
As we are going to run all the tests with plugin’s default settings this is all we need. The build file just registers the “jmeter” plugin from the repository provided.
3. Create src directory and needed artifacts
For the JMeter plugin to work, create src/test/jmeter -directory and drop in a jmeter.properties file which is needed for running the actual JMeter tool. This jmeter.properties file is easy to obtain by downloading JMeter and copying the default jmeter.properties from the tool to this directory.
Creating a JMeter plan
When your Gradle build is set up as instructed you can run the JMeter tool easily by changing to your build directory and running the command
# gradle jmeterEditor
This downloads all the needed artifacts and launches the graphical user interface for designing JMeter plans.
To make things easy, you can use the MyPlan.jmx provi
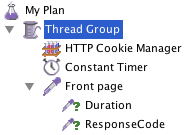 ded in the zip package. The script is really simple: It has a single HTTP Request Sampler (named Front page) set up to make a request to http://localhost:9090 address with two assertions:
- Duration -assertion to check that the time to make the request does not exceed 5 milliseconds. For the sake of this example, this assertion should fail as the request probably takes more than this.
- ResponseCode -assertion to check that the response code from the server is 200 (OK). This should pass as long as there is a web server running in port 9090 (we’ll come to this later).
It is recommended to give your Samplers and Assertions sensible names, as you refer directly to these names later when mapping the test results to your Testlab test cases.
The created plan(s) should be saved to the src/test/jmeter -directory we created earlier, as Gradle’s JMeter plugin automatically executes all plans from this directory.
Setting up a Jenkins job
1. Install Jenkins
If you don’t happen to have Jenkins CI server available, setting one up locally couldn’t be easier. Download the latest release to a directory and run it with
# java -jar jenkins.war --httpPort=9090
Wait a bit, and Jenkins should be accessible from http://localhost:9090 with your web browser.
The JMeter plan we went through earlier made a request to http://localhost:9090. When you are running your Jenkins with the command said, JMeter will fetch the front page of your Jenkins CI server when the tests are run. If you prefer to use some other Jenkins installation you might want to edit the MyPlan.jmx provided to point to this other address.
2. Install needed Jenkins plugins
Go to Manage Jenkins > Manage Plugins > Available and install
- Gradle Plugin
- Meliora Testlab Plugin
- Performance Plugin
- xUnit Plugin
2.1 Configure plugins
Go to Manage Jenkins > Configure System > Gradle and add a new Gradle installation for your locally installed Gradle.
3. Create a job
Add new “free-style software project” job to your Jenkins and configure it as follows:
3.1 Add build step: Execute shell
Add a new “Execute shell” typed build step to copy the contents of your earlier setup Gradle project to the job’s workspace. This is needed as the project is not in a version control repository. Setup the step as for example:
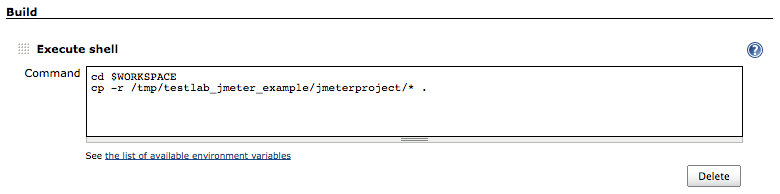
.. Or something else that will make your Gradle project available to Jenkins job’s workspace.
Note: The files should be copied so that the root of the workspace contains the build.gradle file for launching the build.
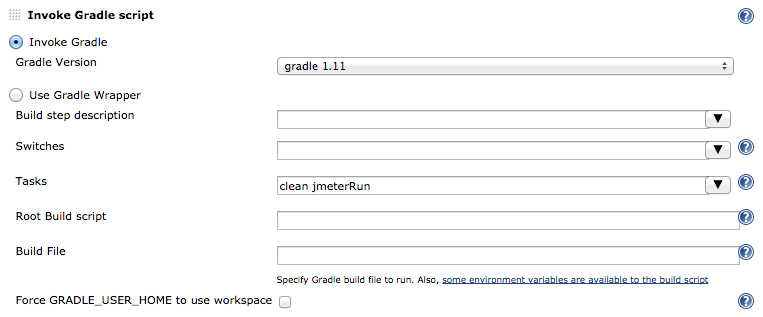
3.2 Add build step: Invoke Gradle script
Select your locally installed Gradle Version and enter “clean jmeterRun” to the Tasks field. This will run “gradle clean jmeterRun” command for your Gradle project which will clean up the workspace and execute the JMeter plan.
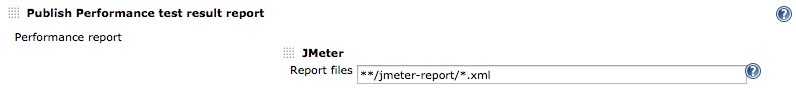
3.3 Add post-build action: Publish Performance test result report (optional)
Jenkins CI’s Performance plugin provides you trend reports on how your JMeter tests have been run. This plugin is not required for Testlab’s integration but provides handy performance metrics on your Jenkins job view. To set up the action click “Add a new report”, select JMeter and set the Report files as “**/jmeter-report/*.xml”:
Other settings can be left to defaults or you can configure the settings for your liking.
3.4 Add post-build action: Publish xUnit test result report
Testlab’s Jenkins plugin works in a way, that it needs the test results to be available in the so-called xUnit format. In addition, this will generate test result trending graphs to your Jenkins job view. Add a post-build action to publish the test results resolved from JMeter assertions as follows by selecting a “Custom Tool”:
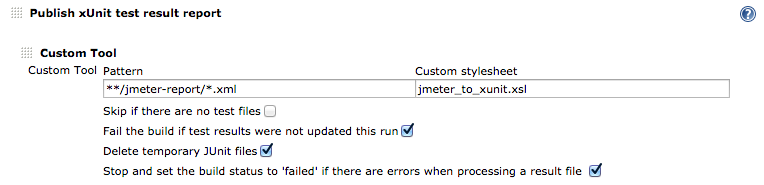
Note: The jmeter_to_xunit.xsl custom stylesheet is mandatory. This translates the JMeter’s log files to the xUnit format. The .xsl file mentioned is located in the jmeterproject -directory in the zip file and will be available in the Jenkins’ workspace root if the project is copied there as set up earlier.
3.5 Add post-build action: Publish test results to Testlab
The above plugins will set up the workspace, execute the JMeter tests, publish the needed reports to Jenkins job view and translate the JMeter log file(s) to xUnit format. What is left is to push the test results to Testlab. For this, add a “Publish test results to Testlab” post-build action and configure it as follows:
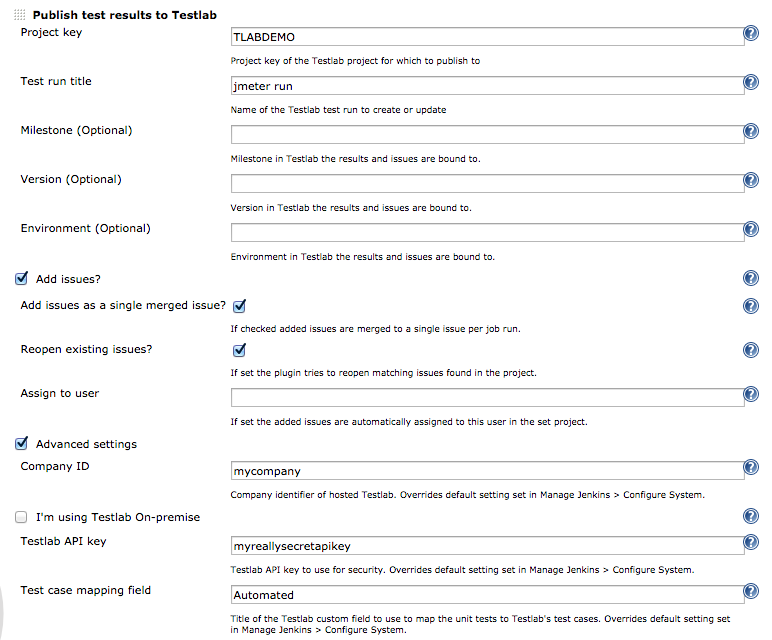
For the sake of simplicity, we will be using the “Demo” project of your Testlab. Make sure to configure the “Company ID” and “Testlab API key” fields to match your Testlab environment. The Test case mapping field is set to “Automated” which is by default configured as a custom field in the “Demo” project.
If you haven’t yet configured an API key to your Testlab, you should log on to your Testlab as a company administrator and configure one from Testlab > Manage company … > API keys. See Testlab’s help manual for more details.
Note: Your Testlab’s edition must be one with access to the API functions. If you cannot see the API keys tab in your Manage company view and wish to proceed, please contact us and we get it sorted out.
Mapping JMeter tests to test cases in Testlab
For the Jenkins plugin to be able to record the test results to your Testlab project your project must contain matching test cases. As explained in the plugin documentation, your project in Testlab must have a custom field set up which is used to map the incoming test results. In the “Demo” project field is already set up (called “Automated”).
 Every assertion in JMeter’s test plan will record a distinguishing test result when run. In the simple plan provided, we have a single HTTP Request Sampler named “Front page”. This Sampler is tied with two assertions (named “Duration” and “ResponseCode”) which check if the request was done properly. When translated to xUnit format, these test results will get identified as <Sampler name>.<Assertion name>, for example:
- Front page/Duration will be identified as: Front page.Duration and
- Front page/ResponseCode will be identified as: Front page.ResponseCode
To map these test results to test cases in the “Demo” project,
1. Add test cases for JMeter assertions
Log on to Testlab’s “Demo” project, go to Test case design and
- add a new Test category called “Load tests”, and to this category,
- add a new test case “Front page speed”, set the Automated field to “Front page.Duration” and Approve the test case as ready and
- add a new test case “Front page response code”, set the Automated field to “Front page.ResponseCode” and Approve the test case as ready.
Now we have two test cases for which the “Test case mapping field” we set up earlier (“Automated”) contains the JMeter assertions’ identifiers.
Running JMeter tests
What is left to do is to run the actual tests. Go to your Jenkins job view and click “Build now”. A new build should be scheduled, executed and completed – probably as FAILED. This is because the JMeter plan has the 5-millisecond assertion which should fail the job as expected.
Viewing the results in Testlab
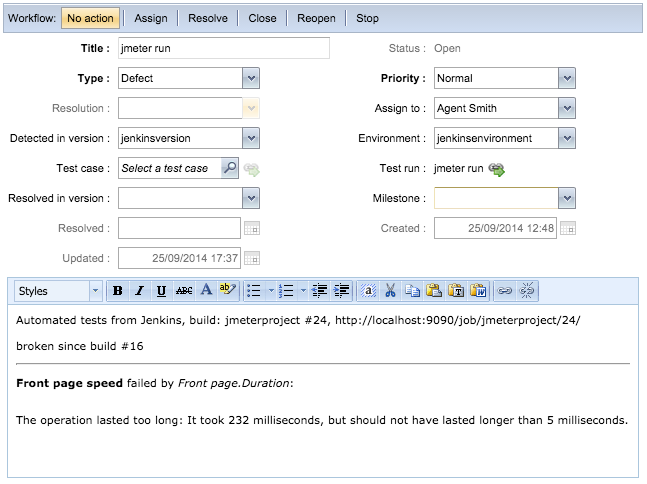
Log on to Testlab’s “Demo” project and select the Test execution view. If everything went correctly, you should now have a new test run titled “jmeter run” in your project:
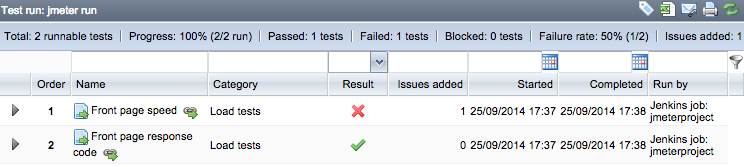
As expected, the Front page speed test case reports as failed and Front page response code test case reports as passed.
As we configured the publisher to open up issues for failed tests we should also have an issue present. Change to Issues view and verify, that an issue has been opened up:
Viewing the results in Jenkins CI
The matching results are present in your Jenkins job view. Open up the job view from your Jenkins:
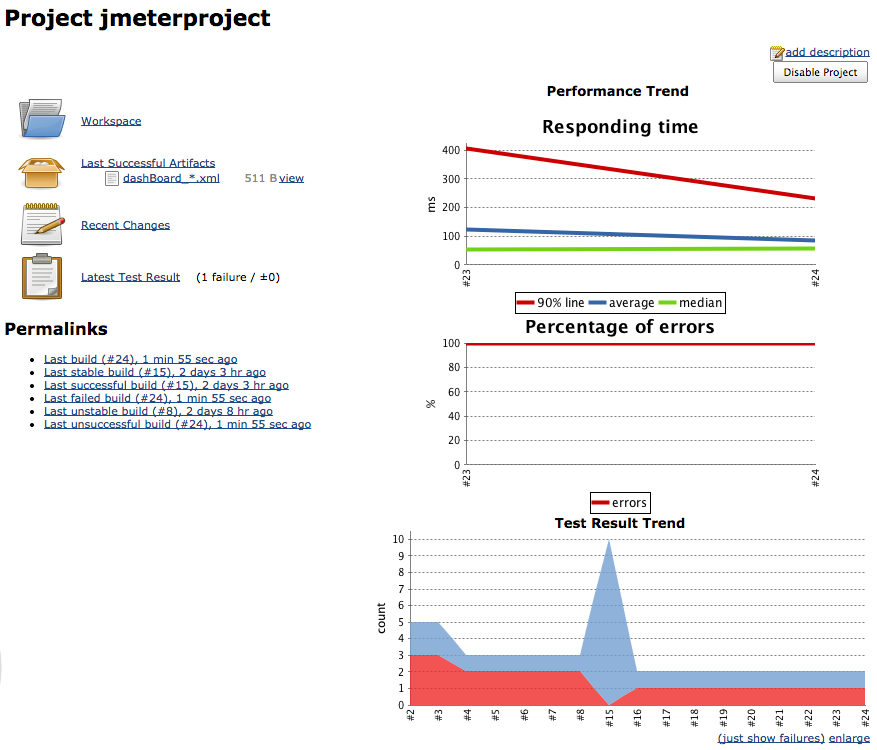
The view holds the trend graphs from the plugins we set up earlier: “Responding time” and “Percentage of errors” from Performance plugin and “Test result Trend” from xUnit plugin.
To see the results of the assertions, click “Latest Test Result”:
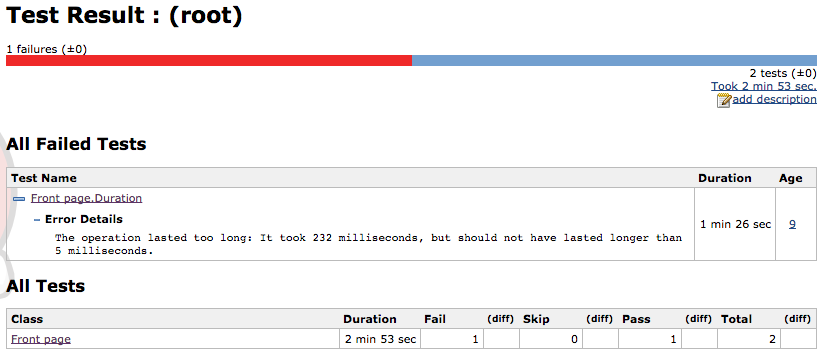
The results show that the Front page.Duration test failed and one test has passed (Front page.ResponseCode).
-
Links referred
http://jmeter.apache.org/ Apache JMeter home page http://jmeter.apache.org/usermanual/index.html Apache JMeter user manual http://jmeter.apache.org/usermanual/component_reference.html#assertions Apache JMeter assertion reference http://blazemeter.com/blog/how-use-jmeter-assertions-3-easy-steps BlazeMeter: How to Use JMeter Assertions in 3 Easy Steps https://www.melioratestlab.com/wp-content/uploads/2014/09/testlab_jmeter_example.zip Needed assets for running the example https://github.com/kulya/jmeter-gradle-plugin Gradle JMeter plugin http://www.gradle.org/ Gradle home page http://mirrors.jenkins-ci.org/war/latest/jenkins.war Latest Jenkins CI release https://www.melioratestlab.com/wp-content/uploads/2014/09/jmeter_to_xunit.xsl_.txt XSL-file to translate JMeter JTL file to xUnit format https://wiki.jenkins-ci.org/display/JENKINS/Meliora+Testlab+Plugin Meliora Testlab Jenkins Plugin documentation